Autlán is committed to generating value in our Autlán Manganese, Autlán Energy, Autlán EMD and Autlán Metallorum Operating Units; complying with applicable legislation; satisfying our customers’ needs; ensuring the physical integrity of our employees; contributing to the development of our neighboring communities and assuring sustainable operations; and continuously improving our quality and environmental management systems.
Sustainable Development
Certifications
Autlán operates with diverse certifications that underpin our commitment to the environment and to quality.


Performance parameters
Autlán’s vision of shared value goes beyond compliance with the law because, through innovation, we continuously seek new alternatives to contribute to the mitigation of climate change.
Across our entire production chain, we measure our use of natural resources and promote efficiency in their consumption, as well as implementing continuous actions to improve our environmental performance index.
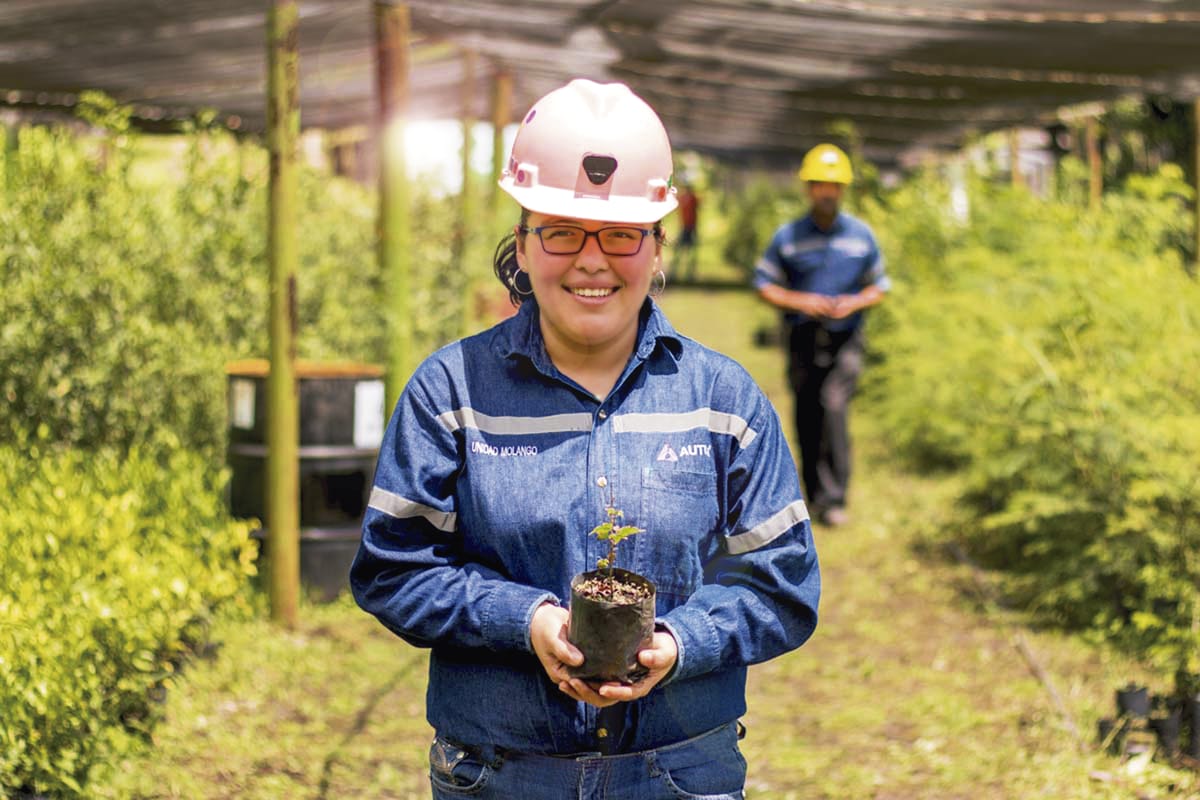
Autlán considers it of paramount importance to invest in the conservation of our ecosystems. To this end, we have created and maintain nurseries that have made us proactive in reforestation activities.
Reforestation (Trees planted / donated)
2019
137,469
2020
106,323
2021
87,892
2022
88,414
2023
75,789
2024
49,478
reforested trees in the region of native species such as oaks, pines, liquidambar, among others.
We are responsible in the consumption of water resources and have implemented different operational controls to increase the volume of the water we reuse.
Autlán’s units and plants are implementing strategies to reduce water extraction and improve recirculation processes.
| Water consumption (thousands of cubic meters) | ||||||||
|---|---|---|---|---|---|---|---|---|
| 2019 | 2020 | 2021 | 2022 | 2023 | 2024 | |||
| Mining Division | 381.39 | 459.59 | 475.16 | 421.92 | 382.6 | 244.6 | ||
| Ferroalloys Division | 561.1 | 501.11 | 590.06 | 616.51 | 628.7 | 555.0 | ||
| Metallorum Division | 480.68 | 390.51 | 221.02 | 38.04 | 1.261 | 0.383 | ||
| Autlán EMD | 71.12 | 63.86 | 63.93 | 54.11 | 42.8 | 56.3 | ||
| Autlán Total | 1,494 | 1,415 | 1,350 | 1,130 | 1,014.7 | 856.3 | ||
Regarding Greenhouse Gas (GHG) emissions, energy efficiency improvements were implemented to consume less fuel and electrical energy within our operation, resulting in a total of 1,051,164.57 KTCO2eq. emitted during 2023, under the following GHG emissions efficiency indicators.
| Efficiency in GHG emissions (tons of carbon dioxide equivalent [tCO2eq./t] / ton produced) | ||||||||
|---|---|---|---|---|---|---|---|---|
| 2018 | 2019 | 2020 | 2021 | 2022 | 2023 | |||
| Autlán Manganese (Mining) | 0.40 | 0.37 | 0.33 | 0.38 | 0.25 | 0.35 | ||
| Autlán Manganese (Ferro-alloys) | 2.44 | 3.15 | 2.21 | 2.10 | 3.15 | 2.93 | ||
| Autlán Metallorum* | 0.38 | 0.43 | 0.54 | 0.98 | 0.62 | 0.91 | ||
*Units in gold equivalent ounces
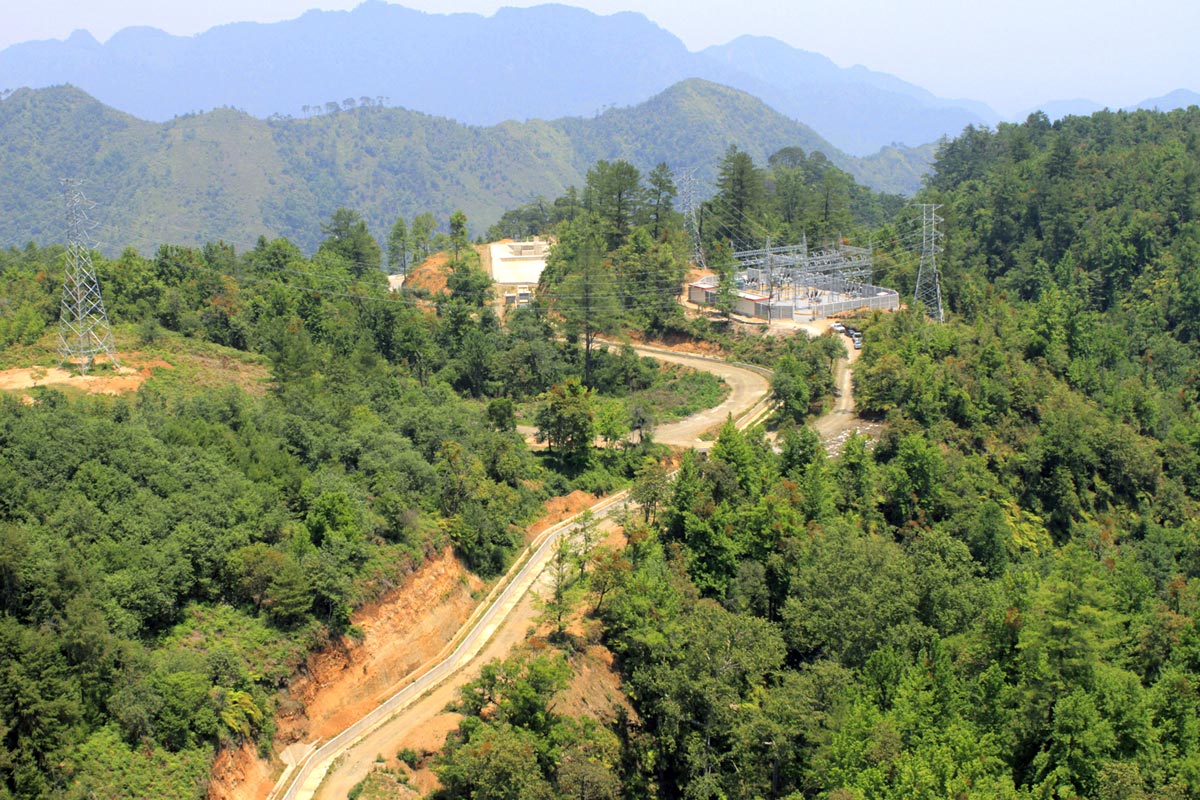
Thanks to the Atexcaco Hydroelectric Plant’s use of the potential energy of water in its 100% renewable energy production, 122 thousand tons of CO2 were not emitted into the atmosphere .
Additionally, the two operating divisions posted savings of 9% in gasoline consumption and the Manganese Division achieved a 15% improvement in energy efficiency.
The following table shows all fuel and electric energy consumption, highlighting the energy efficiency of our operations.
| Efficiency in GHG emissions (tons of carbon dioxide equivalent [tCO2eq./t] / ton produced) | |||||
|---|---|---|---|---|---|
| 2015 | 2016 | 2017 | 2018 | 2019 | |
| Autlán Manganese (Mining) | 0.51 | 0.48 | 0.41 | 0.40 | 0.37 |
| Autlán Manganese (Ferro-alloys) | 2.76 | 2.34 | 2.40 | 2.44 | 3.15 |
| Autlán Metallorum* | 0.38 | 0.43 | |||
*Units in gold equivalent ounces
Thanks to the Atexcaco Hydroelectric Power Plant, 74,373.36* tons of CO2 were stopped by taking advantage of the potential energy of water, being 100% renewable.
| Energy Efficiency (Giga Joules / tonne produced [GJ/t]/ ounces produced) | ||||||||
|---|---|---|---|---|---|---|---|---|
| 2019 | 2020 | 2021 | 2022 | 2023 | 2024 | |||
| Autlán Manganese (Mining) | 2.11 | 1.93 | 2.29 | 0.81 | 0.77 | 0.60 | ||
| Autlán Manganese (Ferro-alloys) | 10.38 | 9.95 | 17.33 | 14.74 | 13.81 | 15.20 | ||
| Autlán Metallorum | 5.13 | 6.19 | 10.24 | 3.67 | 6.12 | – | ||
| Autlán EMD (Ratio GJ/tn EMD) | 2,004.6 | 2,204.2 | 2,192.7 | 2,268 | 9.30 | 2.057 | ||
*Units in gold equivalent ounces
*Figures based on 2021´s electric factor (tCO2e/MWh)